A chart of accounts is a list of all the individual financial accounts a business uses.
These accounts are typically organized in company’s general ledger into categories such as assets, liabilities, income, and expenses, with each account assigned a unique code or number for identification and reference purposes.
Deep Dive into Chart of Accounts
The general ledger serves as the central repository for all of a company’s financial transactions.
Each account listed in the chart of accounts (COA) has a corresponding ledger account in the general ledger.
Financial transactions are recorded in the appropriate ledger account, as dictated by the COA’s categorization, ensuring that transactions are organized and tracked systematically.
The COA is the financial framework of any business, crucial for accurate financial documentation and analysis. Acting as the financial DNA of business accounting, it provides a detailed directory of various accounts essential for financial accounting practices.
It encompasses all financial activities within an organization, with each account representing a distinct category – such as revenue, expense, or asset. Although the structure of a COA may vary to accommodate a business’s size, industry, and specific needs, its primary goal is to offer a clear and comprehensive view of the organization’s financial health.
Why Is Chart of Accounts Important?
The chart of accounts serves as the backbone for accurate financial reporting, compliance with accounting standards, and efficient financial management. By categorizing every transaction a business undertakes, the COA ensures that financial statements accurately reflect the company’s true financial position.
This systematic categorization aids in adhering to regulatory requirements, facilitates in-depth financial analysis, and supports informed decision-making. Additionally, by streamlining accounting processes, the COA enhances efficiency and minimizes errors – a critical advantage for businesses with complex transactions.
Moreover, the COA is instrumental in budgeting and forecasting. It provides a detailed framework for analyzing past transactions, invaluable for projecting future financial performance. The structure of the COA also promotes financial transparency and accountability, fostering trust among stakeholders.
Importantly, the COA is designed to be adaptable, evolving with the business to include new accounts as necessary, ensuring its continued relevance. Thus, the COA is more than just an organizational tool; it is a fundamental component that underpins the entire financial management process, essential for maintaining financial integrity and enabling strategic growth.
Basic Structure of Chart of Accounts
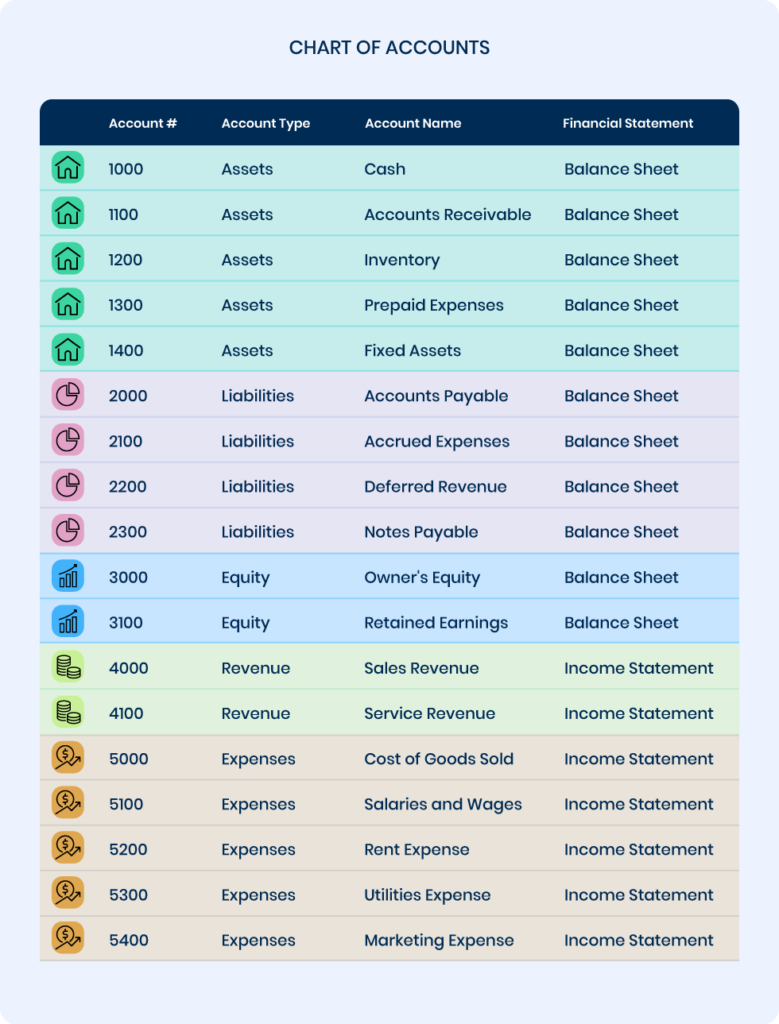
The basic structure of a chart of accounts is organized in a way that supports the collection of information to construct financial statements, and includes five main categories: assets, liabilities, equity, income, and expenses. These categories are then further divided into various subcategories for more detailed tracking and analysis.
For example, under the asset category, businesses may have subcategories such as cash, investments, inventory, accounts receivable, etc. Likewise, under the expense category, there may be subcategories for operating expenses, cost
of goods sold, etc. The specific accounts and subcategories will vary depending on the business type and industry.
1) Assets
Assets are economic resources controlled by the business as a result of past transactions or events, from which future economic benefits are expected to flow to the business. Assets are typically divided into:
Current Assets
Current assets, or short-term assets, include cash and other resources that are expected to be liquidated or turned into cash within one year or one operating cycle, whichever is longer. Examples of current assets are cash, marketable securities, inventory, and accounts receivable, all of which play a critical role in managing the day-to-day financial operations of a business.
- Cash and Cash Equivalents
- Accounts Receivable
- Inventory
- Prepaid Expenses
Non-Current Assets (Fixed Assets)
Non-current assets, also known as fixed assets, are utilized over a more extended period and are typically not considered quickly convertible into cash. These assets play a pivotal role in a company’s long-term financial health and growth potential. Investment in non-current assets reflects a commitment to future business sustainability and efficiency, as they are used in the production of goods, supply of services, or for rental to others.
- Land and Buildings
- Equipment
- Furniture and Fixtures
- Intangible Assets
2) Liabilities
Liabilities represent the financial obligations of a business that are due to be paid to external parties. These are settled over time through the transfer of economic benefits including money, goods, or services. Like assets, liabilities are bifurcated into current and non-current.
Current Liabilities
Current liabilities, or short-term liabilities, are obligations that are due within one year. These include accounts payable, wages, taxes owed, and current portions of long-term debt which are crucial for managing immediate financial responsibilities.
- Accounts Payable
- Short-term Debt
- Accrued Liabilities
- Unearned Revenue
Non-Current Liabilities (Long-term Liabilities)
Long-term liabilities are financial obligations that are due after more than one year. Financing through long-term liabilities allows a business to manage its immediate cash flow needs while planning for its long-term strategy.
- Long-term Debt
- Deferred Tax Liabilities
- Lease Obligations
3) Equity
Equity, often referred to as shareholders’ equity or owner’s equity, represents the residual interest in the assets of the entity after deducting liabilities. In simpler terms, it’s the net amount of finances that the owners or shareholders have invested in the company. This category may include:
- Common Stock
- Retained Earnings
- Additional Paid-in Capital
Equity accounts will vary significantly based on the structure of the business. For instance, whether it’s a corporation, partnership, or sole proprietorship.
4) Income
Income accounts reflect the revenues generated by the business from its operational activities. These are inflows of assets or settlements of liabilities that result in increases in equity, other than those relating to contributions from equity participants. Typical income accounts are:
- Sales Revenue
- Service Revenue
- Interest Income
Income accounts are instrumental in assessing the profitability and operational efficiency of a business.
5) Expenses
Expenses represent outflows or the using up of assets or the incurrence of liabilities during a period from delivering or producing goods, rendering services, or carrying out other activities that constitute the entity’s ongoing major operations. They include:
- Cost of Goods Sold (COGS)
- Operating Expenses
- Wages and Salaries
- Rent and Utilities
Account Numbering System: A Key Aspect of the COA’s Structure
The numbering system forms the foundation of your chart of accounts, offering a structured method to organize financial information. It’s designed to be intuitive and scalable, allowing for future growth without requiring a complete redesign.
This categorization goes beyond merely adhering to accounting standards; it aligns with your business’s operational needs. For example, manufacturing businesses may require detailed accounts for inventory and cost of goods sold, whereas service-based businesses might prioritize expense accounts related to service delivery.
Unique numbers assigned to accounts enable easy identification and classification. This organization aids in the efficient recording and retrieval of financial data. While the numbering scheme may vary with the size and complexity of the business, it generally follows a logical sequence aligned with account categories. Assigning numbers to accounts is a thoughtful process, designed to accommodate future expansions by reserving gaps for new accounts as the business grows or diversifies.
How To Create a Chart of Accounts: A Step-by-Step Guide
Before you start, it’s important to keep in mind that your chart of accounts should reflect the unique financial needs and structure of your business. You should also consider the future growth and potential changes to the COA. As such, it’s essential to have a clear understanding of the company’s financial transactions and how they should be classified.
1. Identify Your Business Structure and Needs
Begin by thoroughly assessing your business model, size, industry, and specific financial transactions. This assessment will help tailor the COA to accurately reflect how your business operates financially. Consider the types of transactions you frequently handle, such as sales, purchases, payroll, and loans. Also, think about future business expansions or diversifications and how they might impact your accounting needs.
2. Decide on a Numbering System
Choose between a simple sequential system (1000, 1001, …) for smaller businesses or a more complex hierarchical system for larger, more diverse operations. The latter might incorporate segments indicating departments, locations, or account types (e.g., 1010-01-00 where 1010 indicates the account type, 01 the department, and 00 the specific account).
Ensure the system has enough gaps for future expansion. For example, all asset accounts might start with a 1, liabilities with a 2, and so on, leaving room within each category for additional accounts.
3. Categorize Accounts
Break down your accounts into the five main categories: Assets, Liabilities, Equity, Revenue, and Expenses. This aligns with the standard structure of financial statements. Within each main category, create subcategories relevant to your business operations. For example, under Assets, you might have Current Assets, Fixed Assets, and Intangible Assets.
Tailor these categories and subcategories to reflect your business’s unique operational needs, ensuring they capture all types of transactions your business encounters.
4. Assign Account Numbers
Within the numbering system you’ve chosen, assign numbers to each account. Start with broader categories at the beginning of the range and get more specific as you move up. Leave space within each category for new accounts.
For example, you might use the 1000 series for current assets, starting with Cash at 1010, Accounts Receivable at 1020, and so on, leaving room between numbers for future accounts.
5. Detail Each Account
Provide each account with a clear title and a brief description that outlines the types of transactions it should capture. Ensure that everyone involved in financial management and bookkeeping understands the account titles and uses them correctly, which will help maintain the integrity of your financial data.
6. Implement and Review
Incorporate your newly created COA into your accounting software or manual accounting system. This might involve setting up each account within the software and ensuring that it aligns with your COA structure. Run a series of transactions through your COA to test its functionality and practicality.
Later on, regularly review and update your COA to reflect changes in your business operations, industry standards, or regulatory requirements. This may involve adding new accounts, removing obsolete ones, or reclassifying existing accounts to better suit your business’s evolving needs.
FAQ: Chart of Accounts (COA)
How is chart of accounts connected to financial statements?
Financial statements, including the balance sheet, income statement, and cash flow statement, are derived from the information recorded in the general ledger. The structure of the COA plays a crucial role in shaping these three financial reports:
- Balance Sheet: Accounts listed under assets, liabilities, and equity in the COA are directly linked to the balance sheet. The balance sheet provides a snapshot of the company’s financial position at a specific point in time, showcasing what the company owns (assets) versus what it owes (liabilities and equity).
- Income Statement: The income statement reflects the company’s financial performance over a period, primarily focusing on revenues and expenses, which are categorized in the COA. By tracking these accounts, the income statement highlights the company’s net income or loss, derived from subtracting total expenses from total revenues.
- Cash Flow Statement: Although not directly categorized in the COA, the cash flow statement utilizes information from the assets, liabilities, and equity sections, especially those accounts that affect cash and cash equivalents. It provides insights into the company’s cash inflows and outflows over a period.
What are the best practices for integrating a chart of accounts with accounting software or ERP systems?
Ensure the COA structure is compatible with the software, use standardized account numbers and names, and regularly review the integration for any updates or changes in business processes. Regularly back up your data and perform test runs before finalizing any changes or updates to the COA within the accounting software. Also consider any security measures needed to protect sensitive financial information stored in the system.
How can a chart of accounts be optimized for real-time financial reporting and analytics?
By ensuring it is well-organized, logically structured, and fully integrated with accounting software that supports real-time data processing and analysis.
What role does the chart of accounts play in tax preparation and compliance?
It ensures accurate financial reporting and record-keeping, facilitating the calculation of taxable income and adherence to tax laws.
Can the chart of accounts influence the audit process, and if so, how can it be designed to facilitate audits?
Yes, a clear and logical COA can streamline the audit process by making it easier to trace transactions and validate financial statements. Design it with transparency and compliance in mind, aligning closely with accounting standards.
How often should a chart of accounts be updated, and what triggers these updates?
Update the COA at least annually or when significant changes occur, such as business expansion, diversification, or changes in accounting regulations.
How should a company approach the classification of new types of transactions or financial instruments in the chart of accounts?
By analyzing the nature of the transaction or instrument, consulting accounting standards, and possibly creating new accounts or sub-accounts to accurately reflect them.
Can the structure of a chart of accounts differ significantly between industries, and if so, how?
Yes, the structure can vary widely between industries to reflect specific financial transactions and reporting requirements, such as manufacturing needing detailed inventory accounts or technology companies focusing on R&D and intellectual property.
How AP automation software can help in managing a chart of accounts?
Accounts payable (AP) automation software plays a significant role in enhancing the management and optimization of a chart of accounts. It automates routine accounting tasks, reducing the likelihood of manual errors and saving time. This automation extends to the categorization of transactions, which boosts data accuracy and ensures financial records are consistently reliable.
With real-time reporting capabilities, AP automation solutions provide immediate access to financial data, facilitating quick and informed decision-making. They also support compliance efforts by keeping up with the latest accounting standards and tax laws.
As businesses grow, these technologies can adapt to changing needs, such as incorporating new accounts or modifying existing ones, thus offering scalability. Moreover, technology streamlines the audit process by organizing financial data in an easily accessible manner for auditors. Finally, through advanced analytics, technology can offer insights for further optimization of the chart of accounts, identifying trends and areas for improvement.